A Softer Auction Week Highlights a Market Moving at Different Speeds
The latest week brought a clear pullback in auction results. Across the combined capitals, 1,735 homes went to auction, 7.3% fewer than the previous week and 17.7% fewer than at the same time last year. The preliminary clearance rate slipped to 47.2%, down from 48.4% and the lowest preliminary reading since April 2020.
That national result does not tell the whole story. Sydney’s preliminary clearance rate rose to 53.8%, while Brisbane’s fell to 26.2%. Melbourne’s 38% weekly drop in auction volume came ahead of the Melbourne Cup holiday, so fewer auctions there need to be read in that seasonal context. Even so, the combined result sits alongside a broader run of falling home values: the capital-city index was down 1.4% over the 28 days to 1 November and 4.9% over the year.
Advertised sale stock adds another layer. Across the capitals, total listings were 20.3% higher than a year earlier, while new listings were 16.1% lower. Rents, by contrast, continued to rise. Together, these indicators point to a market where buyers may find more advertised choice than last year, but conditions differ substantially by city and property type.
What This Means For
First Home Buyers
A lower combined clearance rate and higher total advertised stock may give some buyers more room to compare properties and negotiate. But the city-level spread matters: Sydney’s preliminary result improved, while Brisbane’s remained particularly soft. A national average cannot tell you whether competition is easing for the specific home you are considering.
Investors
Rental conditions remain supportive on the reported figures: the national median rent was $715, up 5.3% over the year, and the combined-capital median was $747, up 5.2%. Rental listings across the capitals were also 8.0% higher than a year ago, suggesting more advertised rental stock than last year. These measures vary by market, so rental growth alone does not establish the likely performance of an individual investment.
Up-Sizers
Falling values and more total sale listings may create options for households looking to move, but the same market conditions affect the home they need to sell. With capital-city values down 6.3% year to date, the key question is not just whether the next property is more attainable, but how the current home’s value and the target market are moving relative to each other.
Auction Clearances In Select Markets
Sydney stood out among the larger markets: 731 auctions were held, up 17.3% on the week, and its preliminary clearance rate rose 5.6 percentage points to 53.8%. Still, auction volumes were 33% lower than a year earlier. Melbourne recorded 514 auctions and a 49.5% preliminary clearance rate; Brisbane had 238 auctions but cleared only 26.2%, its fourth result below 30% in five weeks. These are preliminary results and may change as more outcomes are collected.
Regional results also varied. Newcastle and Lake Macquarie recorded a 52.9% preliminary clearance rate across 23 auctions, while the Gold Coast was at 22.6% across 88. The Sunshine Coast recorded 54.6%, but on only 31 auctions. These snapshots underline why regional results, particularly with smaller volumes, should be read as local signals rather than a definitive ranking.
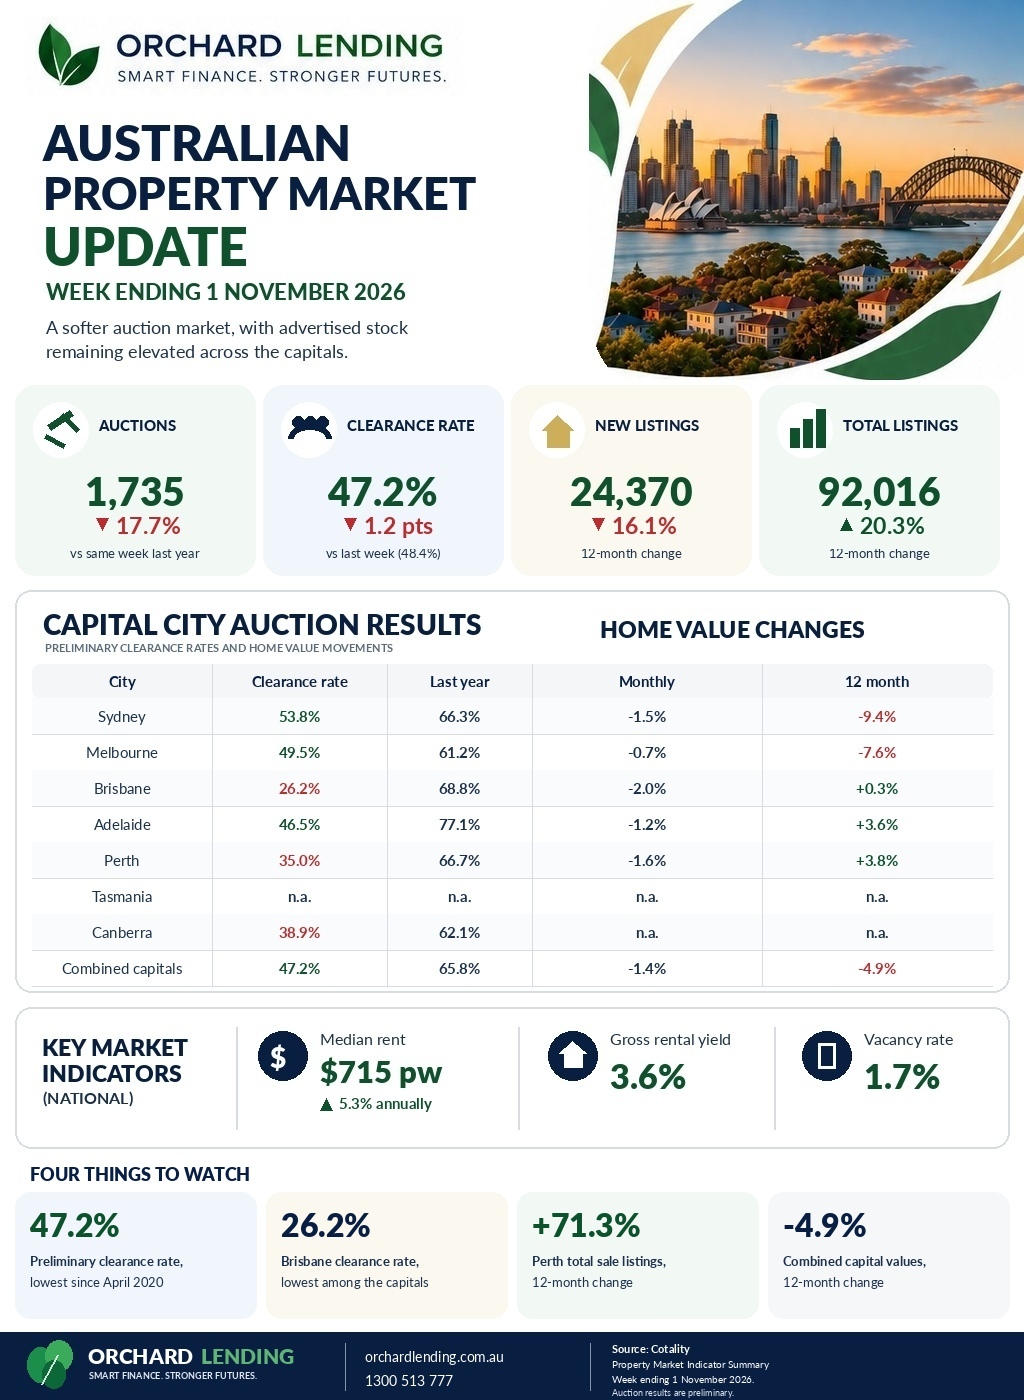
Key Market Indicators
| Indicator | Latest | Comparison |
|---|---|---|
| Combined-capital auctions | 1,735 | Down 7.3% on week; down 17.7% year on year |
| Preliminary clearance rate | 47.2% | 48.4% previous week; 65.8% same time last year |
| Capital-city home values | Down 1.4% | 28 days to 1 November |
| Capital-city new listings | 24,370 | Down 16.1% year on year |
| Capital-city total listings | 92,016 | Up 20.3% year on year |
| National median rent | $715 per week | Up 5.3% year on year |
The contrast between fewer new listings and a larger pool of total listings suggests that properties already advertised are contributing to the higher stock level. Meanwhile, the fall in home values across the capitals is not uniform: annual values were down 9.4% in Sydney and 7.6% in Melbourne, but up 3.6% in Adelaide and 3.8% in Perth. Rising rents are a separate signal, not evidence that sale prices are strengthening.
Questions We’re Hearing
Does a 47.2% clearance rate mean prices will keep falling?
It signals a softer auction week, not a certain path for prices. The report also records falling recent home values, but auction outcomes vary by city and preliminary results are subject to revision. One week cannot establish what happens next.
Are buyers getting more choice?
There are 20.3% more total capital-city listings than a year ago, which points to a larger advertised pool overall. Yet new listings are down 16.1%, and the balance differs between cities. The figures suggest more existing stock is on the market, not that every buyer has more suitable options.
Are rental conditions easing?
Rental listings across the capitals were 8.0% higher than a year earlier, while the national median rent rose 5.3%. Those movements point in different directions: advertised rental stock has grown, but rents remain higher year on year. The report’s figures do not support a single conclusion for every city.
The Orchard Lending View
This week’s story is not simply that auctions weakened. The preliminary combined clearance rate reached a multi-year low, but Sydney improved week to week, and Melbourne’s auction count fell ahead of a holiday. The aggregate captures a soft result; the city details show different conditions beneath it.
The broader indicators lean towards less pressure in parts of the sales market: capital-city values are down over the month and year, and total sale listings are considerably higher than last year. But that should not be mistaken for a uniform buyer’s market. Adelaide and Perth remain above their year-ago value levels, while Sydney and Melbourne are below. Location continues to shape the practical meaning of the national figures.
For buyers and sellers, the evidence supports careful comparison rather than a confident prediction. Investors can note that rents are rising while rental stock has also increased, but neither figure settles the economics of a particular property. What is clear is that the auction, value, listing and rental indicators are not all moving together; the next reports will help show whether this divergence persists.
What We’ll Be Watching Next Week
Auction activity: We’ll watch whether the preliminary clearance rate recovers and how many auctions actually take place. A change in both volume and results would help distinguish a quieter calendar from a shift in selling conditions.
Differences between markets: Sydney’s improvement contrasts with Brisbane’s weak result. Whether those city-level gaps continue will matter more than the combined figure alone.
Listings and rental conditions: The relationship between new and total sale listings, alongside rental stock and rent growth, will show whether available choice is changing while rental costs continue to rise.
The main uncertainty is whether this week’s soft auction result is temporary or part of a sustained pattern. For now, the evidence points to a varied market, not one national direction.