A Higher Clearance Rate, But Far Fewer Auctions
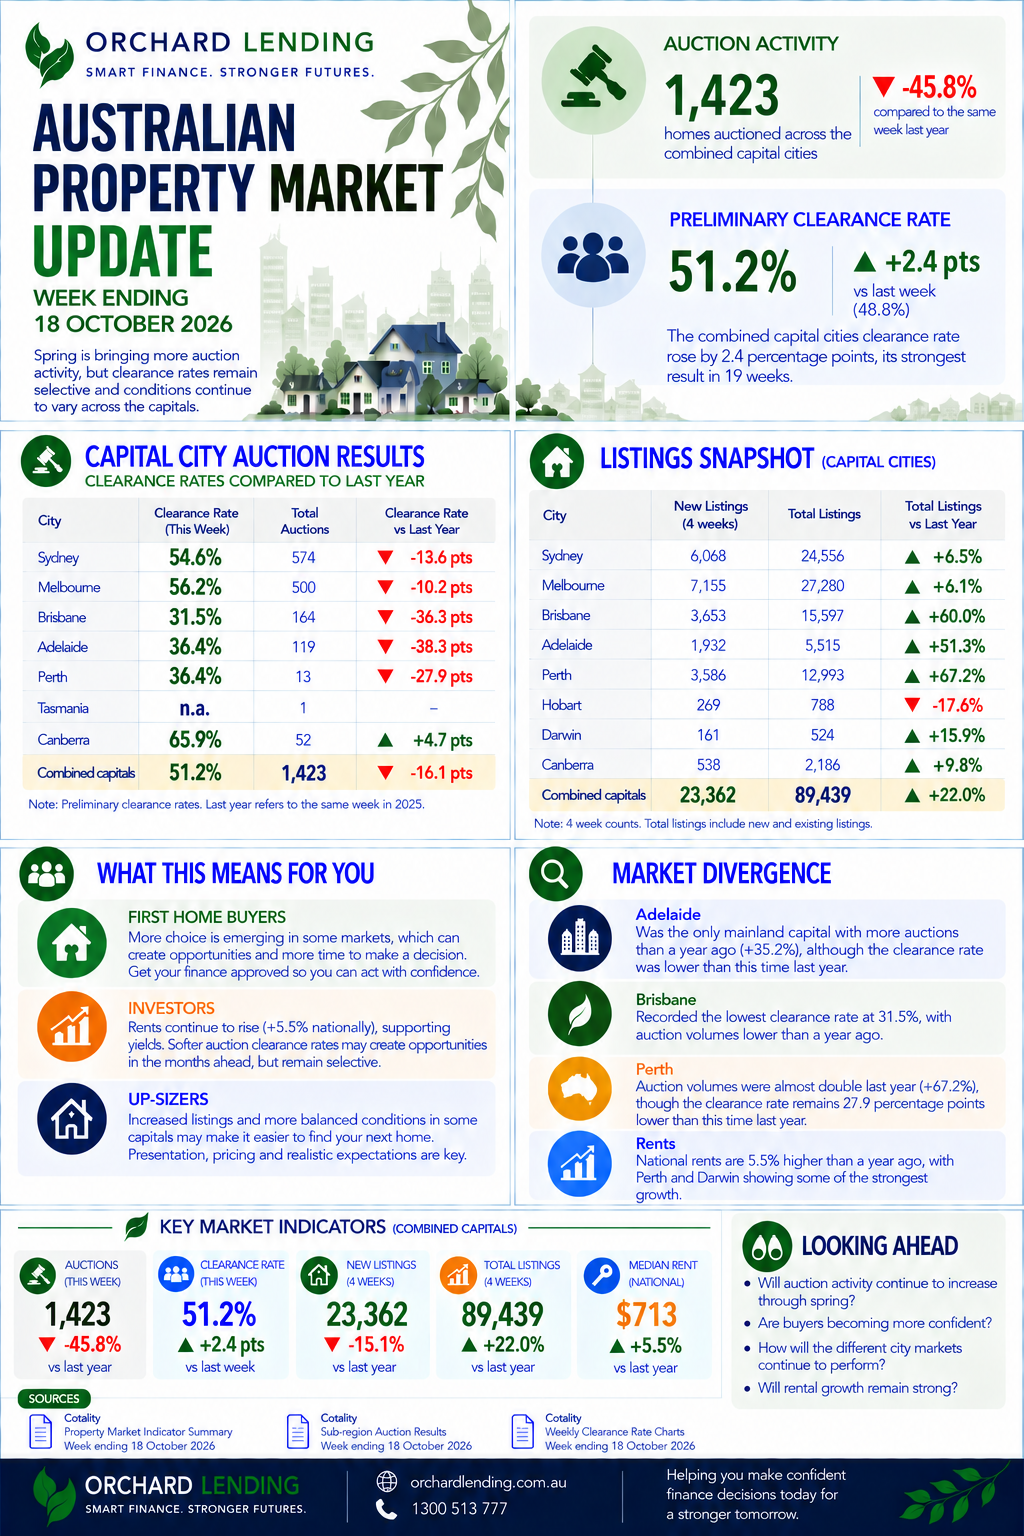
There were fewer homes under the hammer across the combined capitals in the week ending 18 October, but a larger share of reported results were successful. Cotality recorded 1,423 auctions, down 18.6% on the previous week and 45.8% on the same week last year. From 1,084 results collected, the preliminary weighted clearance rate was 51.2%: up 2.4 percentage points week on week and the strongest preliminary result in four weeks.
That is a mixed signal, rather than a clear change in direction. Auction volumes have been more than 30% below the equivalent week last year since mid-August. The spring-to-date preliminary clearance average is 52.0%, also slightly below the 52.3% winter average. A higher success rate is worth noting, but it came alongside a sharply smaller pool of auctions.
Melbourne accounted for most of the weekly fall in auction numbers. Its 500 auctions were down from 703 the week before and 1,142 a year earlier. The decline coincided with Victoria’s new reserve-price disclosure requirements applying to auctions from 16 October. It is too early to say whether the rule change altered vendors’ timing; the overlap is notable, but does not establish a cause.
Other indicators point to a market that remains under pressure beyond the auction room. Cotality’s latest four-week measure to 18 October showed combined-capital home values falling 1.2%. Over the same four-week period, new listings were 15.1% lower than a year earlier, while total listings were 22.0% higher. The clearance-rate improvement therefore sits alongside softer short-term values and a larger pool of advertised stock than a year ago.
What This Means For
First Home Buyers
Fewer auctions may mean fewer chances to compete in a crowded Saturday, but the clearance rate alone does not tell you what is happening in your target suburb. In Victoria, public reserve prices may make an auction’s stated threshold clearer; they do not guarantee a property will sell at that price or within a buyer’s budget. The wider increase in total advertised stock may offer more choice, depending on location and property type.
Investors
Rent is still rising: Cotality’s September rental snapshot put the national median at $713 a week, up 5.5% over the year. That is useful context, not a substitute for checking a property’s likely rent against its price, costs and finance. With short-term values falling across the capital-city markets shown in Cotality’s latest report, an investor’s decision needs to account for both rental conditions and the possibility that capital values may remain soft.
Up-Sizers
A softer market can change the price gap between the home you own and the one you want, but not necessarily in your favour. Capital-city values and regional values have been moving at different speeds, and individual suburbs can diverge too. Look at comparable homes on both sides of the move rather than assuming a national trend makes the upgrade easier.
Auction Clearances In Select Markets
Melbourne and Sydney both recorded higher preliminary clearance rates than the previous week: 56.2% and 54.6%, respectively. But their auction volumes were down year on year by 56.2% in Melbourne and 46.8% in Sydney. Sydney’s clearance rate also remained below its spring-to-date average of 55.5%.
Results elsewhere were more uneven. Brisbane’s preliminary rate rose to 31.5% from 21.4% a week earlier, but remained well below 67.8% a year ago. Adelaide’s rate fell to 36.4%, even though it was the only mainland capital with more auctions than in the corresponding week last year. Canberra recorded the highest capital-city rate, 65.9%, but that was based on 41 reported results from 52 auctions.
Regional results underline the spread: Melbourne’s Inner South recorded 64.9%, while the Gold Coast was at 32.1%. These are preliminary submarket snapshots, and the number of reported results is much smaller than for the combined capitals. They are useful for showing variation, not for ranking whole markets with certainty.
Key Market Indicators
| Indicator | Latest | Comparison |
|---|---|---|
| Combined-capital auctions | 1,423 | 1,749 previous week; 2,626 year earlier |
| Preliminary clearance rate | 51.2% | 48.8% previous week |
| Combined-capital home values | -1.2% | 28 days to 18 October |
| Combined-capital new listings | 23,362 | -15.1% year on year, four weeks to 18 October |
| Combined-capital total listings | 89,439 | +22.0% year on year, four weeks to 18 October |
| National median rent | $713 per week | +5.5% year on year, September |
The listings figures tell a more nuanced story than either one alone. Fewer new properties were added than a year ago, yet total advertised stock was much higher. Cotality counts as new a property not advertised in the previous 75 days; total listings also include properties advertised before. That combination suggests buyers have a larger pool to consider, even without a surge in fresh listings. It does not, by itself, establish why stock has accumulated.
Questions We’re Hearing
Does a higher clearance rate mean the market is strengthening?
Not on its own. The preliminary rate improved, but auction numbers were far below last year and the spring average remains below winter’s. We would want to see stronger results sustained across more auctions and more weeks before calling it a broad recovery.
Did Victoria’s new reserve-price rules cause Melbourne’s auction drop?
That cannot be concluded from this week’s figures. The requirements applied to Victorian auctions from 16 October, and Melbourne’s auction count fell sharply. But the data shows timing, not causation; vendors may have adjusted campaign timing, while broader auction activity was already subdued.
Are buyers seeing less competition because new listings are lower?
Not necessarily. New listings were down year on year, but total listings were up. The amount of choice and competition still depends on the local market, price bracket and type of property being considered.
The Orchard Lending View
The headline improvement in clearance rates deserves some credit, but the volume context changes how we read it. Just over half of reported auctions cleared, yet there were fewer properties going to auction than in the previous week, and far fewer than a year earlier. This is not enough evidence to say buyer demand has turned a corner.
There is no single national auction story either. Sydney and Melbourne improved week on week, Brisbane remained weak against its year-ago result, Adelaide’s clearance rate slipped, and Canberra’s standout figure came from a modest sample. The reported value and listings measures add another layer: short-term values are softer, while the stock already advertised is considerably higher than last year.
For buyers, that may create more room to compare properties, but it does not make every home negotiable. Sellers need to be alert to the choices buyers have; investors need to weigh rent against purchase costs and borrowing. The sensible conclusion is a selective market with uneven conditions, not a clear recovery and not a uniform downturn everywhere.
What We’ll Be Watching Next Week
Auction activity: Around 1,240 auctions are scheduled across the capitals for the week ending 25 October, down from 1,423 held in the week just reported. Melbourne has 489 scheduled, roughly 70% fewer than in the corresponding week last year. We’ll watch what actually goes ahead and how preliminary results hold up.
Buyer demand: The key question is whether the improved clearance rate persists as auction volumes change, or proves to be a short-lived weekly lift.
Differences between markets: Brisbane, Adelaide and Canberra produced sharply different results from Sydney and Melbourne. Further weeks will show whether those gaps persist.
Listings and rental conditions: We’ll keep an eye on whether total sale stock remains elevated and whether rent growth continues alongside softer dwelling values.
Next week’s results should add useful evidence, but they will not settle the bigger question on their own. For now, lower auction activity, varied city results and rising total listings point to a market that remains selective rather than broadly strengthening.
Source note: Market figures are drawn from Cotality’s Property Market Indicator Summary, data to the week ending 18 October 2026. Rental indicators are reported for September 2026. Auction clearance rates are preliminary.