Is Sydney’s property market losing momentum, or simply changing gear?
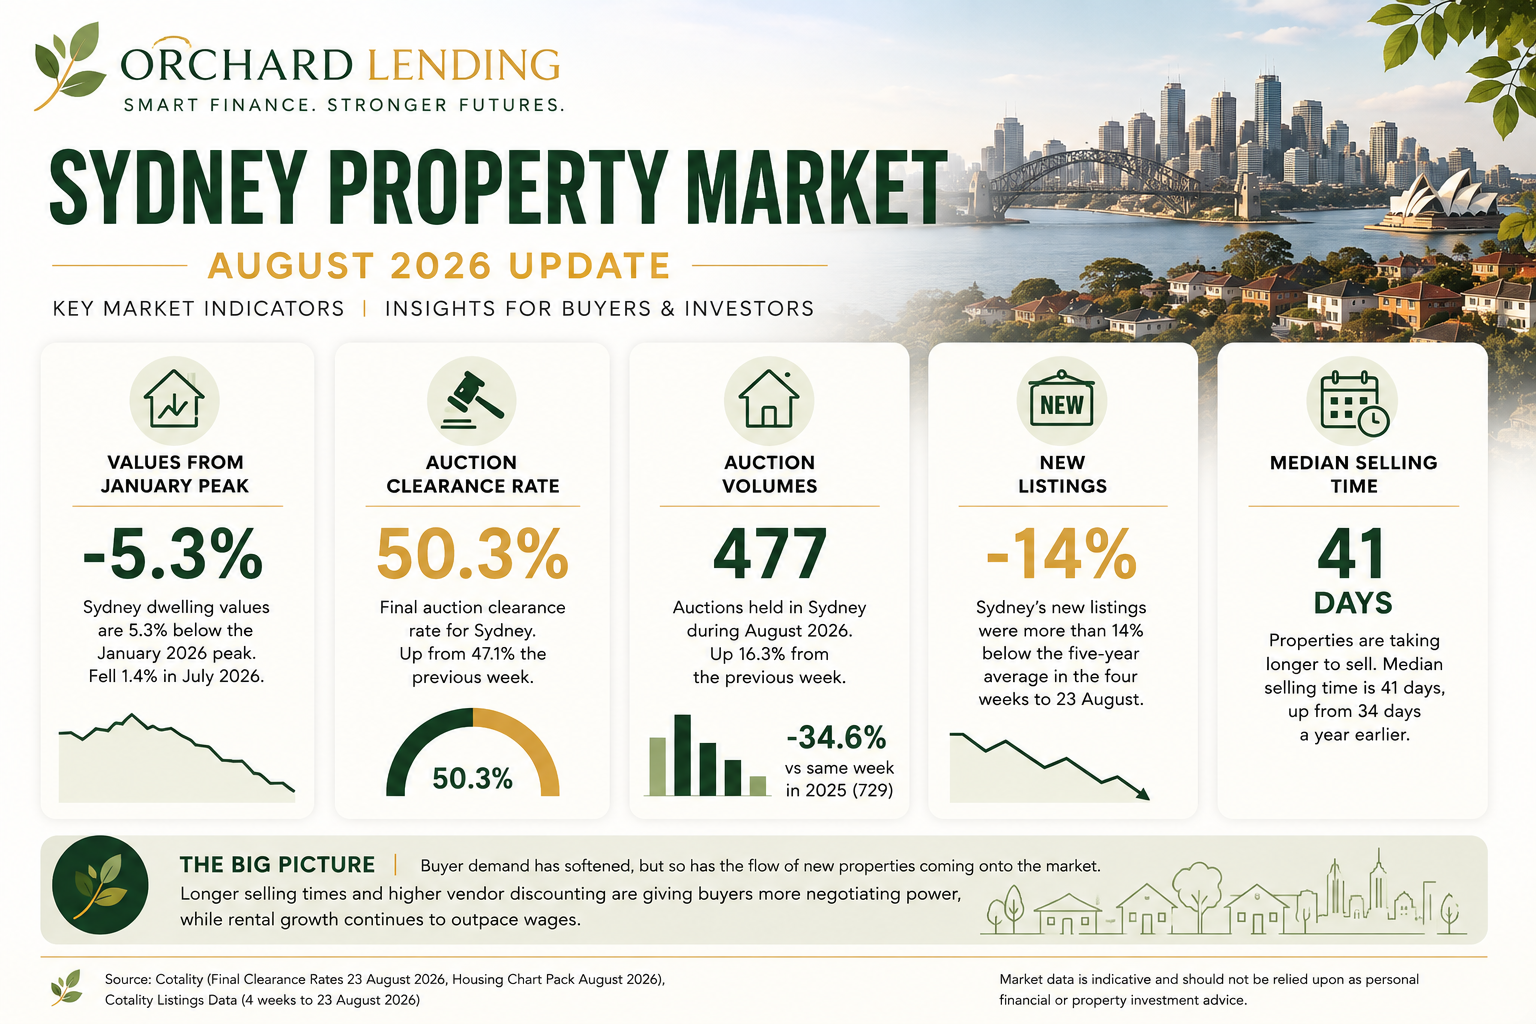
Sydney’s property market is clearly in a different phase from the strong growth seen through much of 2025. Cotality’s latest data shows Sydney dwelling values fell 1.4% in July, taking the three-month decline to 4.0% and leaving values 5.3% below their January 2026 peak. At the same time, auction activity remains subdued, listings are behaving differently from a typical spring market, and sellers are having to negotiate harder to secure a sale.
But calling this simply a “Sydney property crash” would miss the more interesting story. Demand has weakened, but so has the flow of new properties coming onto the market. Sydney’s new listings were more than 14% below the five-year average in the four weeks to 23 August, meaning many potential sellers appear to be choosing to wait rather than test today’s market. Meanwhile, total listings have been building as properties take longer to sell. (Property Update)
For buyers, that combination can create something quite different from a straightforward falling-price market: more negotiating power, but not necessarily an endless supply of bargains. For investors, falling values are being accompanied by continued rental growth, while the differences between Sydney’s regions and between Sydney and other capital cities remain significant.
1. Sydney home-value movements
Sydney is currently one of Australia’s weaker major housing markets. Cotality’s July data shows Sydney dwelling values fell 1.4% over the month, 4.0% over the three months and 2.0% over the year. Values are now approximately 5.3% below the January 2026 peak. House values have been softer again, falling 1.7% in July and 4.6% over the latest quarter. (OpenAgent)
That is a meaningful change from the conditions Sydney experienced earlier in the cycle. However, the peak-to-current decline also needs some perspective. Cotality’s August Housing Chart Pack notes that even a hypothetical 20% decline from Sydney’s peak would take values back only to around May 2021, illustrating how much growth accumulated during the pandemic period. Cotality presents this as a scenario rather than a forecast. (Cotality)
2. Auction clearance rates
Auction clearance rates provide one of the clearest real-time indications that buyer demand has cooled. For the week ending 23 August, Sydney recorded 477 auctions, with a final clearance rate of 50.3%. That was an improvement from 47.1% the previous week, making Sydney the only capital city to improve on both auction volume and clearance rate that week. However, Sydney’s result remained well below the 71.6% clearance rate recorded in the same week of 2025.
The broader trend is important. Cotality says combined capital-city clearance rates had fallen from around 66% in February to the low 40% range by late June, and have remained subdued since. Historically, stronger clearance rates tend to coincide with stronger price growth, so the current auction results suggest buyer demand remains cautious. A 50% clearance rate doesn’t mean that half of Sydney’s properties are suddenly “worthless”. It means the auction process is producing much less competition between buyers than it was a year ago.
3. Auction volumes
Sydney’s auction volume tells another important part of the story. There were 477 Sydney auctions in the week ending 23 August, up 16.3% from the previous week. But compared with the same week in 2025, volumes were down 34.6%, from 729 auctions to 477. That is significant because fewer properties are being taken to auction at exactly the time when buyer demand is weaker.
Cotality’s longer-term analysis suggests vendors are increasingly choosing alternatives to auction, including private treaty sales, pre-auction transactions and withdrawals. Across Australia, the share of new listings going to auction had fallen to just over 30% by June, compared with almost 45% in November 2025. Sydney and Melbourne have led that retreat.
In other words, the auction numbers are telling us about seller behaviour as well as buyer behaviour.
4. New listings
This may be one of the most interesting parts of Sydney’s current market. You might expect falling prices and the approach of spring to bring a flood of new properties onto the market. Instead, Cotality’s latest listings data shows Sydney has been leading a national slowdown in new listings. In the four weeks to 23 August, Sydney’s new listings were more than 14% below the five-year average. Melbourne was more than 9% below average and Brisbane almost 5% below average.
That suggests many potential vendors are looking at current prices and deciding that waiting may be preferable to selling today. This is an important distinction. Sydney currently has weaker buyer demand, but it isn’t being met by an enormous surge in fresh supply.
5. Total listings
While new listings are falling, total advertised stock has been moving in the opposite direction. Nationally, total listings reached more than 137,000 properties in the four weeks to 23 August, which was 1.7% above the five-year average. Cotality says total stock had been almost 26% below average in mid-January, highlighting how quickly conditions have changed.
The reason is relatively simple: properties are taking longer to sell.
Sydney’s median selling time has increased to around 41 days, compared with 34 days a year earlier. That means even though fewer new properties are being added, existing stock can accumulate when buyers take longer to commit. For buyers, this is one of the more encouraging developments. More properties sitting on the market for longer can provide additional time to research, compare properties and negotiate rather than feeling forced to make a decision immediately.
6. Vendor discounting
Vendor discounting is another sign that the balance between buyers and sellers has shifted. Sydney’s median vendor discount has widened to approximately 4.2%, compared with 3.3% a year earlier. In simple terms, sellers are increasingly having to accept a price below their original asking price to secure a sale. Across the combined capital cities, the median vendor discount had widened to around 3.9% over the three months to July, up from 3.2% in the three months to April.
This doesn’t mean every seller is accepting a 4% reduction. The figure is a median and conditions can vary enormously between suburbs and properties. But the direction is useful: buyers are gaining more negotiating leverage.
7. Rental movements
The rental market is telling a rather different story from the sales market. Cotality reported national rental growth of 5.9% annually in July, continuing to outpace wage growth of 3.3%. Gross rental yields had also risen to 3.7% nationally as property values softened while rents continued to increase.
Sydney rents have also continued to rise. Cotality data reported by OpenAgent shows Sydney rents increased approximately 5.5% over the year to July, with house rents up 6.1% and unit rents up 4.4%. For investors, this creates an interesting contrast: capital values are falling while rental income is still increasing. That doesn’t automatically make every Sydney investment attractive. Interest costs, land tax, maintenance, vacancy, property quality and borrowing capacity still matter. But the rental side of the equation is currently considerably stronger than the sales side.
8. Differences between Sydney regions
Perhaps the biggest mistake a buyer or seller can make right now is thinking of “Sydney” as one single property market. Auction results, buyer demand and price movements can vary significantly between regions and individual suburbs. The latest weekly data continues to show strong competition for some quality properties even while broader clearance rates remain subdued. Recent reporting from Sydney’s auction market has highlighted properties attracting multiple bidders and selling above reserve, particularly where the property is well located, high quality or relatively scarce. At the same time, other auctions are attracting little or no bidding. (Daily Telegraph)
This creates an increasingly two-speed Sydney market.
A well-presented property in a tightly held suburb can still generate competition. A property that is overpriced, compromised or competing against a large amount of comparable stock can face a very different outcome. For buyers, this means the headline “Sydney prices are falling” shouldn’t automatically be interpreted as “everything is 5% cheaper”. For sellers, it makes accurate pricing and understanding the local competition increasingly important.
9. How Sydney compares with Melbourne, Brisbane, Adelaide and Perth
Sydney isn’t the only capital experiencing weaker conditions, but the degree of change varies considerably. Cotality’s August Housing Chart Pack shows Sydney and Melbourne have experienced the largest recent corrections, with Sydney more than 5% below its January peak. Melbourne has also fallen more than 5% from its peak after several years of relatively subdued growth.
The mid-sized capitals have had a different journey. Brisbane, Adelaide and Perth experienced considerably stronger growth during the preceding boom, leaving them with a larger accumulated buffer even as their markets have now started to soften. Cotality notes that even a hypothetical 20% decline would leave Perth around its April 2025 value, while Brisbane and Adelaide would similarly retain substantial portions of their recent gains.
Auction markets also differ. For the week ending 23 August, Melbourne recorded a final clearance rate of 51.9%, Adelaide 46.7%, Brisbane 32.7% and Perth 27.3%, although the Perth figure was based on only 11 auctions and should therefore be treated cautiously. Sydney’s 50.3% sat between Melbourne and Adelaide. The broader message is important: Australia does not have one property market. Sydney and Melbourne are currently dealing with a more pronounced correction, while the mid-sized capitals are coming off much stronger growth cycles.
10. What this potentially means for buyers and investors
For buyers, the current Sydney market may provide more breathing room than we’ve seen in recent years. Properties are taking longer to sell, vendor discounting has increased, auction clearance rates are around 50%, and new listings are below average. That combination can provide opportunities for buyers who are financially prepared and willing to negotiate rather than compete emotionally at auction.
For investors, the picture is more complicated. Falling property values can improve entry prices, while continued rental growth can support income. However, Sydney’s relatively high property values and comparatively modest rental yields mean investors need to assess the complete cash-flow position rather than relying on capital growth assumptions.
For first-home buyers, a softer market can be helpful because reduced competition may make it easier to negotiate and avoid being caught in a bidding war. But affordability and borrowing capacity remain critical, and a lower purchase price does not necessarily mean a property has suddenly become “cheap”.
For up-sizers, the current environment could be particularly interesting. If both the property being sold and the more expensive property being purchased have fallen in value, the dollar gap between the two can sometimes narrow. The challenge is timing the sale and purchase and making sure the finance works comfortably through the transition.
The Orchard Lending view
Sydney’s property market isn’t simply collapsing. It is changing gear.
Buyer demand has clearly weakened, but vendors are also responding by bringing fewer properties to market. At the same time, existing stock is taking longer to sell, giving buyers more choice and negotiating power. The result is a market where the headline numbers matter, but the local story matters even more.
For anyone considering buying, selling, refinancing or investing in Sydney, the most useful question may no longer be “What is the Sydney market doing?” but “What is happening to the type of property and area I’m actually interested in?” That is where good finance advice and good property research need to meet. The market may be softer, but the right decision still depends on the individual property, the numbers and your own financial position.
Questions we’re hearing about the Sydney market
Is Sydney’s property market falling?
Sydney dwelling values have fallen from their January 2026 peak, with Cotality reporting a 5.3% decline through July. However, the market isn’t moving uniformly, and the current environment is better described as a correction with increased negotiating power for buyers rather than a simple collapse.
Are Sydney buyers gaining more negotiating power?
Yes, there are several signs of this. Auction clearance rates are around 50%, properties are taking longer to sell, and vendor discounting has widened. At the same time, new listings remain below the five-year average, meaning buyers have more leverage without necessarily having an enormous oversupply of properties.
Is now a good time to buy property in Sydney?
There isn’t a universal answer. A softer market can provide opportunities for financially prepared buyers, particularly where vendors are realistic about pricing. However, the right decision depends on the property, location, borrowing capacity and the buyer’s circumstances.
What does the Sydney market mean for property investors?
Investors are facing a mixed picture. Property values have softened while rents continue to rise, which can improve rental yields. However, borrowing costs, taxes, maintenance and the property’s individual cash flow still need to be considered.
Data and market commentary sourced from Cotality and other referenced Australian property-market sources. Market data is indicative and should not be relied upon as personal financial or property investment advice.