Clearances Rebound, But a Bigger Stockpile Tells a More Cautious Story
The combined-capital preliminary auction clearance rate rose to 51.5% in the week ending 8 November, up 4.3 percentage points on the previous week. But that improvement needs context: it was only just above the spring-to-date average of 51.1%, and auction activity remained 43.5% below the same week last year.
Melbourne did most of the lifting. Its preliminary clearance rate climbed to 59.1%, the city’s strongest result in eight weeks, while Sydney moved the other way, slipping to 52.3%. The national headline is therefore less a sign of a uniform lift than a reminder that results can change considerably between cities.
Other indicators add to the mixed picture. Over the latest 28 days, home values fell across every capital city shown, and combined-capital total advertised listings were 20.1% higher than a year ago. New listings, meanwhile, were 18.1% lower. That combination suggests a larger pool of properties remains for sale even as fewer newly advertised homes enter the market. The market is active, but the evidence does not yet point to a broad-based recovery.
Prefer to listen? Hear Kevin discuss this week’s report below;
What This Means For
First Home Buyers
The higher volume of total listings may mean more properties to compare than a year ago, while falling 28-day values in all capitals suggest recent price pressure is still present. But auction conditions differ by city, and an improving clearance rate does not guarantee that every property will be easy to negotiate on. Buyers should focus on comparable homes and local results rather than treating the combined-capital figure as a guide to every suburb.
Investors
The rental figures show annual rent growth of 5.3% nationally, alongside a 7.7% annual increase in total capital-city rental listings. That is a more nuanced signal than rent growth alone: rents are higher than a year earlier, but advertised rental stock has also expanded. Investors weighing a purchase should look at the figures for the specific market and property, rather than assume that annual rent growth translates directly into an individual investment’s return.
Up-Sizers
Recent value declines may affect both the home being sold and the one being purchased, but not necessarily to the same extent. Rising total listings could also widen choice in some areas. The practical question is how the two properties compare in their local market: a capital-city average cannot show whether the price gap between a particular home and its intended replacement has narrowed.
Auction Clearances In Select Markets
Melbourne’s 59.1% preliminary clearance rate across 612 auctions was the strongest result among the major capitals this week. Sydney recorded 52.3% across 709 auctions, down 1.5 percentage points on the previous week. These contrasting results explain much of the difference behind the combined-capital improvement.
Further down the table, Brisbane’s preliminary rate was 31.2% from 178 auctions, while Adelaide recorded 43.5% from 149. Perth’s 36.4% was based on just 17 auctions, so that result is a small weekly sample rather than a robust city-wide verdict. Regional results varied too: the Gold Coast recorded 17.5% across 67 scheduled auctions, while the Sunshine Coast recorded 68.4% across 43. With only 19 Sunshine Coast results collected at the time of the report, that percentage warrants caution. All these clearance rates are preliminary.
Listen To The Discussion Below;
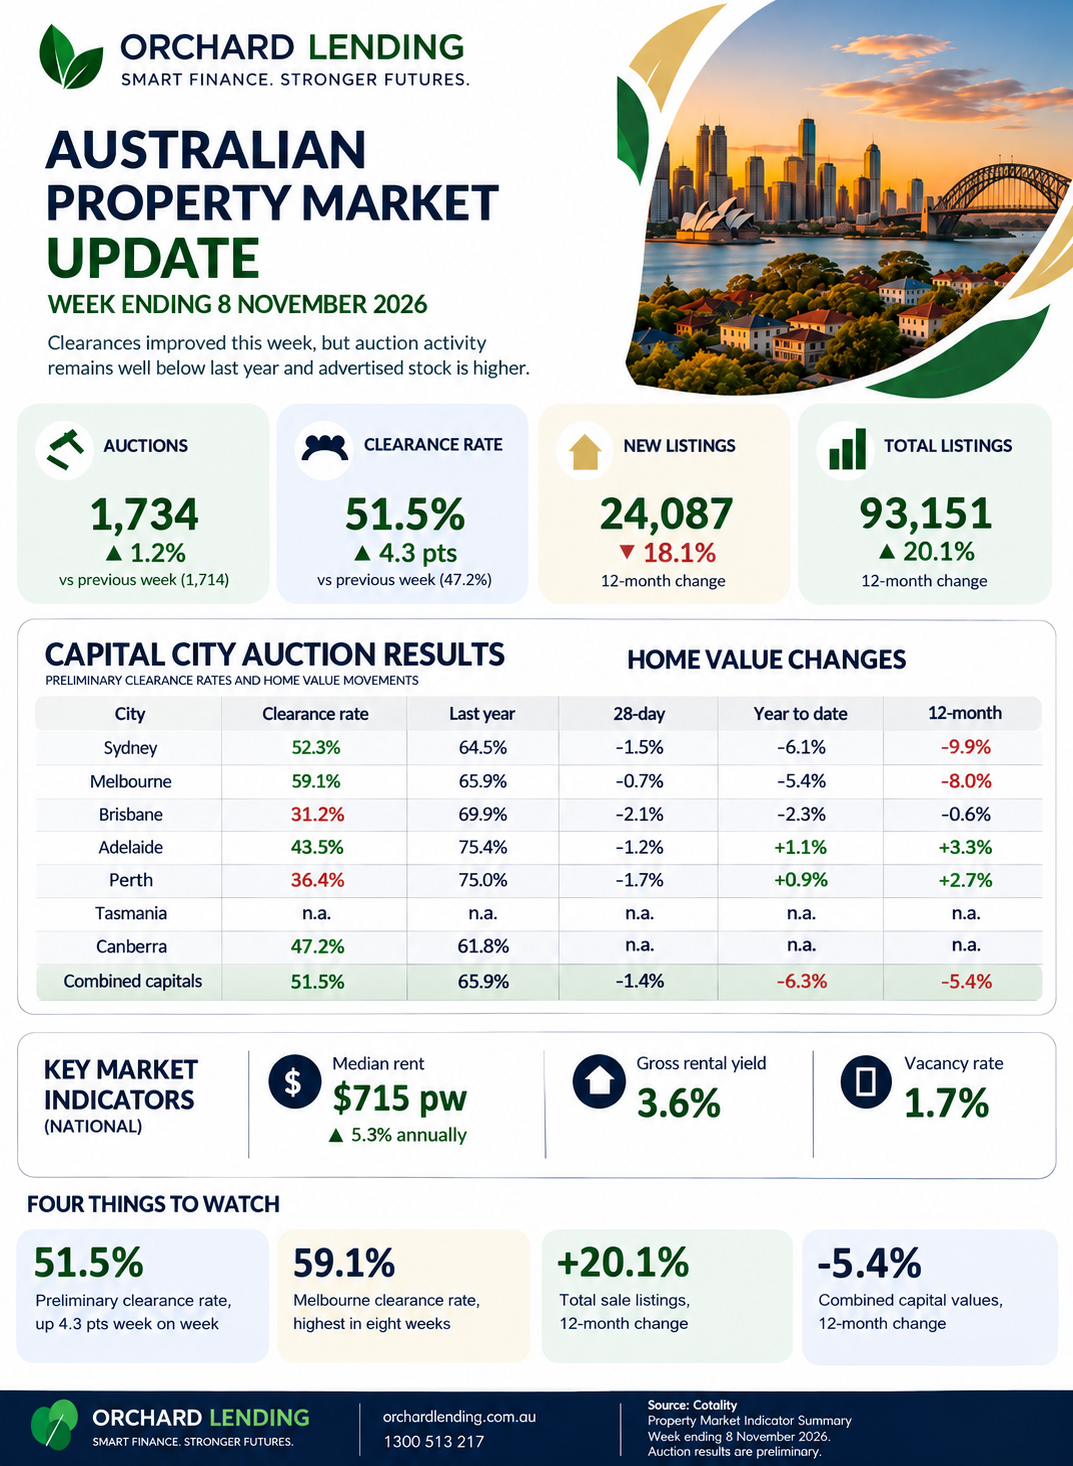
Key Market Indicators
| Indicator | Latest | Comparison |
|---|---|---|
| Combined-capital auctions | 1,734 | +1.2% week on week; -43.5% year on year |
| Preliminary clearance rate | 51.5% | +4.3 percentage points week on week |
| New sale listings, four weeks | 24,087 | -18.1% year on year |
| Total sale listings, four weeks | 93,151 | +20.1% year on year |
| Combined-capital values | -1.4% | 28-day rolling change |
| National median rent | $715 per week | +5.3% year on year |
Fewer new sale listings alongside substantially higher total listings suggests that the overall advertised stock is accumulating even though the flow of newly listed homes is lower. Values also remain under pressure: the 28-day rolling decline was steeper for combined capitals (-1.4%) than for combined regionals (-0.7%). Rental conditions present a separate mix, with annual rent growth occurring alongside more rental listings on the market.
Questions We’re Hearing
Does this week’s higher clearance rate mean the market is turning?
Not on its own. The rate improved, but remained close to the spring-to-date average and auction volumes were still far below the same week last year. Melbourne’s lift was important to the combined result, while Sydney’s rate declined.
Are buyers seeing more choice?
Total sale listings across the capitals were 20.1% above a year earlier, even though new listings were down 18.1%. That points to more advertised stock overall, but actual choice will still depend on location and property type.
Are rents still rising?
The national median rent was up 5.3% over the year to October. At the same time, total rental listings across the capitals were 7.7% higher year on year. The report therefore shows rising annual rents, but also a larger pool of advertised rental homes.
The Orchard Lending View
The strongest message this week is that a better auction result and a stronger market are not the same thing. The clearance rate’s rise is encouraging as a weekly movement, but the year-on-year fall in auction volumes, the modest spring average and the city-level differences all argue for a measured reading.
Sale listings help explain why the headline can feel more positive than the broader market. New supply over the four-week period was lower than last year, yet the total stock available was much higher. This suggests buyers may encounter a deeper pool of advertised properties, while sellers face competition from homes that remain on the market. It does not establish why those properties are still listed or guarantee that every buyer has more leverage.
Values reinforce the need to think locally. Sydney and Melbourne were down 9.9% and 8.0% respectively over 12 months, while Adelaide and Perth were up 3.3% and 2.7%. A combined-capital decline of 5.4% cannot describe each city’s experience. For buyers, sellers, homeowners and investors, the useful conclusion is not that one national direction applies everywhere, but that the relevant market and property matter.
What We’ll Be Watching Next Week
Auction activity: We’ll watch whether the clearance-rate improvement holds as auction volumes change. Clearance rates need to be read alongside the number of auctions held and the preliminary status of results.
Differences between markets: Sydney and Melbourne moved in opposite directions this week. Whether that gap persists will help show if the combined result is broadening or remains concentrated in particular cities.
Listings and rental conditions: The relationship between new and total sale listings remains important, as does the rise in rental listings alongside annual rent growth. Further movement in either could change the balance suggested by this week’s figures.
For now, the picture is one of uneven conditions: some auction measures improved, but values and year-on-year activity remain subdued, while advertised stock is elevated. The next set of results will show whether this week’s auction lift is sustained and whether the listing trends continue.